

Currently, Solana’s price is showing resilience amid market volatility. This recent performance of SOL has increased optimism among market participants as to whether the price of the digital asset could potentially reach the $160 mark in the coming days.
This article mainly aims to provide technical insight into the recent price performance and technical indicators that suggest the crypto asset could reach $160, with an emphasis on the 4-hour and 1-day chart.
At the time of writing, SOL’s price was up over 7% and trading at around $143, with a market cap of over $66 billion and a trading volume of over $3.5 billion. Over the past 24 hours, SOL’s market cap and trading volume have increased by 7.81% and 55.69%, respectively.
Technical insights on SOL’s recent price action
Currently, the price of SOL on the 4-hour chart is trading with bullish momentum above the 100-day Simple Moving Average (SMA). The digital asset is on an upward spiral as after failing to retest the previous low of $121 and given the price movement, there are possibilities that it could still continue its rally.
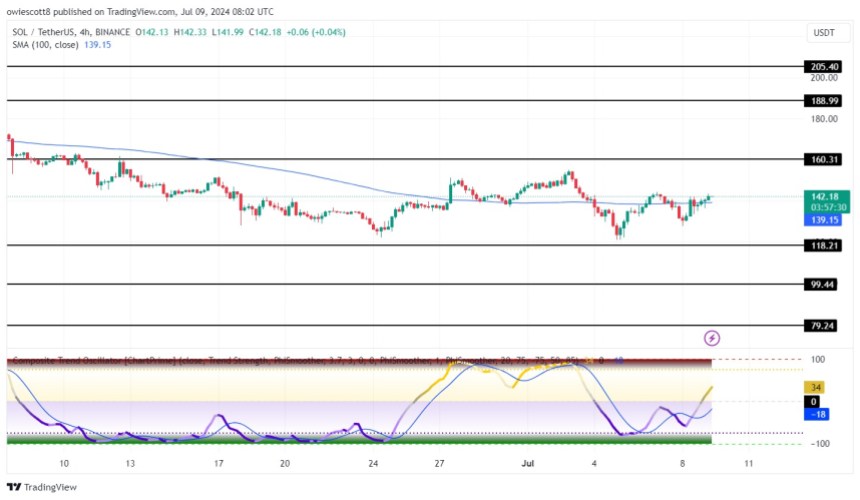
An analytical view of the 4-hour Composite Trend Oscillator also shows that Solana’s price may remain bullish as it has crossed the signal line above the indicator’s SMA and both are trying to break above 50%.
On the 1-day chart, Solana is attempting to make a bullish move towards the 100-day SMA and the $160 resistance level after it formed a double bottom pattern. With this price formation, the digital asset could skyrocket, challenging previous resistance levels.
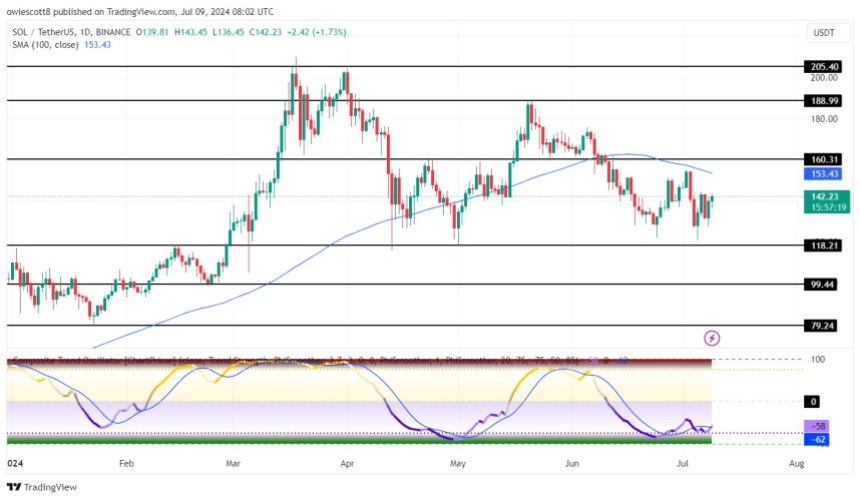
Finally, the composite trend oscillator on the same 1-day chart also indicates that SOL could potentially extend its bullish move as the signal line tries to cross above the indicator’s SMA and both are trending slightly above the oversold zone.
Future prospects if Solana reaches the $160 mark
Considering that Solana is currently attempting an upward rally towards the $160 resistance level, if the price reaches this level and closes above it, the price will continue to rise to test the $188 resistance level. It could likely continue testing the USD 205 resistance level and other higher levels if it breaches the USD 188 level.
However, if the price reaches USD 160 and witnesses a rejection, it will start falling again towards the USD 118 support level. If the price falls below this support level, the price will continue to fall to test the $99 support level. Moreover, the digital asset may witness a steeper decline to test the $79 level and other levels on the chart if it breaks below the $99 support level.