

Bitcoin price is consolidating above the USD 64,000 level. BTC could try to follow Ethereum and recover if it manages to break the USD 65,650 resistance zone.
- Bitcoin started a small recovery wave above the $65,000 level.
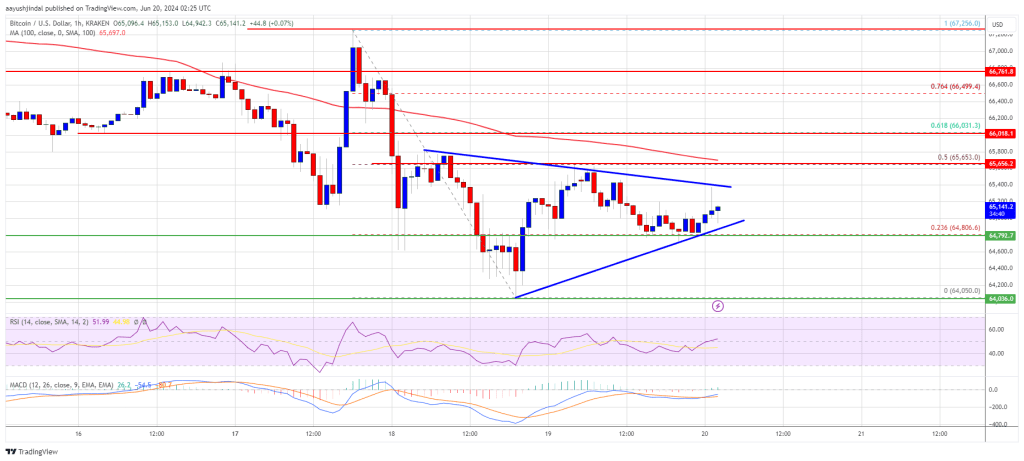
- The price is trading below $65,500 and the 100 hourly Simple Moving Average.
- A short-term contracting triangle is forming with resistance at $65,400 on the hourly chart of the BTC/USD pair (data feed from Kraken).
- The pair could start a recovery wave if it overcomes the USD 65,400 and USD 65,650 resistance levels.
Bitcoin price faces resistance
Bitcoin price extended its losses and traded below the USD 65,000 level. BTC even tested the $64,000 zone. A low was formed at $64,050 and the price is now correcting losses.
There was a small recovery above the USD 64,500 level. The price climbed above the 23.6% Fib retracement level of the recent decline from the $67,255 swing high to the $64,050 low. However, the bears are still active near the $65,500 zone.
Bitcoin is now trading below $65,500 and the 100 hourly Simple Moving Average. A short-term contracting triangle is also forming with resistance at $65,400 on the hourly chart of the BTC/USD pair.
On the upside, the price is facing resistance near the $65,400 level and triangle trendline. The first major resistance could be $65,650, or the 50% Fib retracement level of the recent decline from the $67,255 swing high to the $64,050 low. The next major resistance could be at USD 66,000.
A clear move above the USD 66,000 resistance could trigger a steady rise and send the price higher. In the mentioned case, the price could rise and test the USD 66,550 resistance. Any further gains could send BTC towards the USD 67,500 resistance in the short term.
Another drop in BTC?
If Bitcoin fails to climb above the USD 65,650 resistance zone, it could trigger another decline. The immediate downside support is near the $64,850 level.
The first major support is at $64,400. The next support is now near $64,000. Any further losses could send the price towards the $63,200 support zone in the near term.
Technical indicators:
Hourly MACD – The MACD is now losing pace in the bearish zone.
Hourly RSI (Relative Strength Index) – The RSI for BTC/USD is now above the 50 level.
Major support levels – $64,400, followed by $64,000.
Major resistance levels – $65,400 and $65,650.