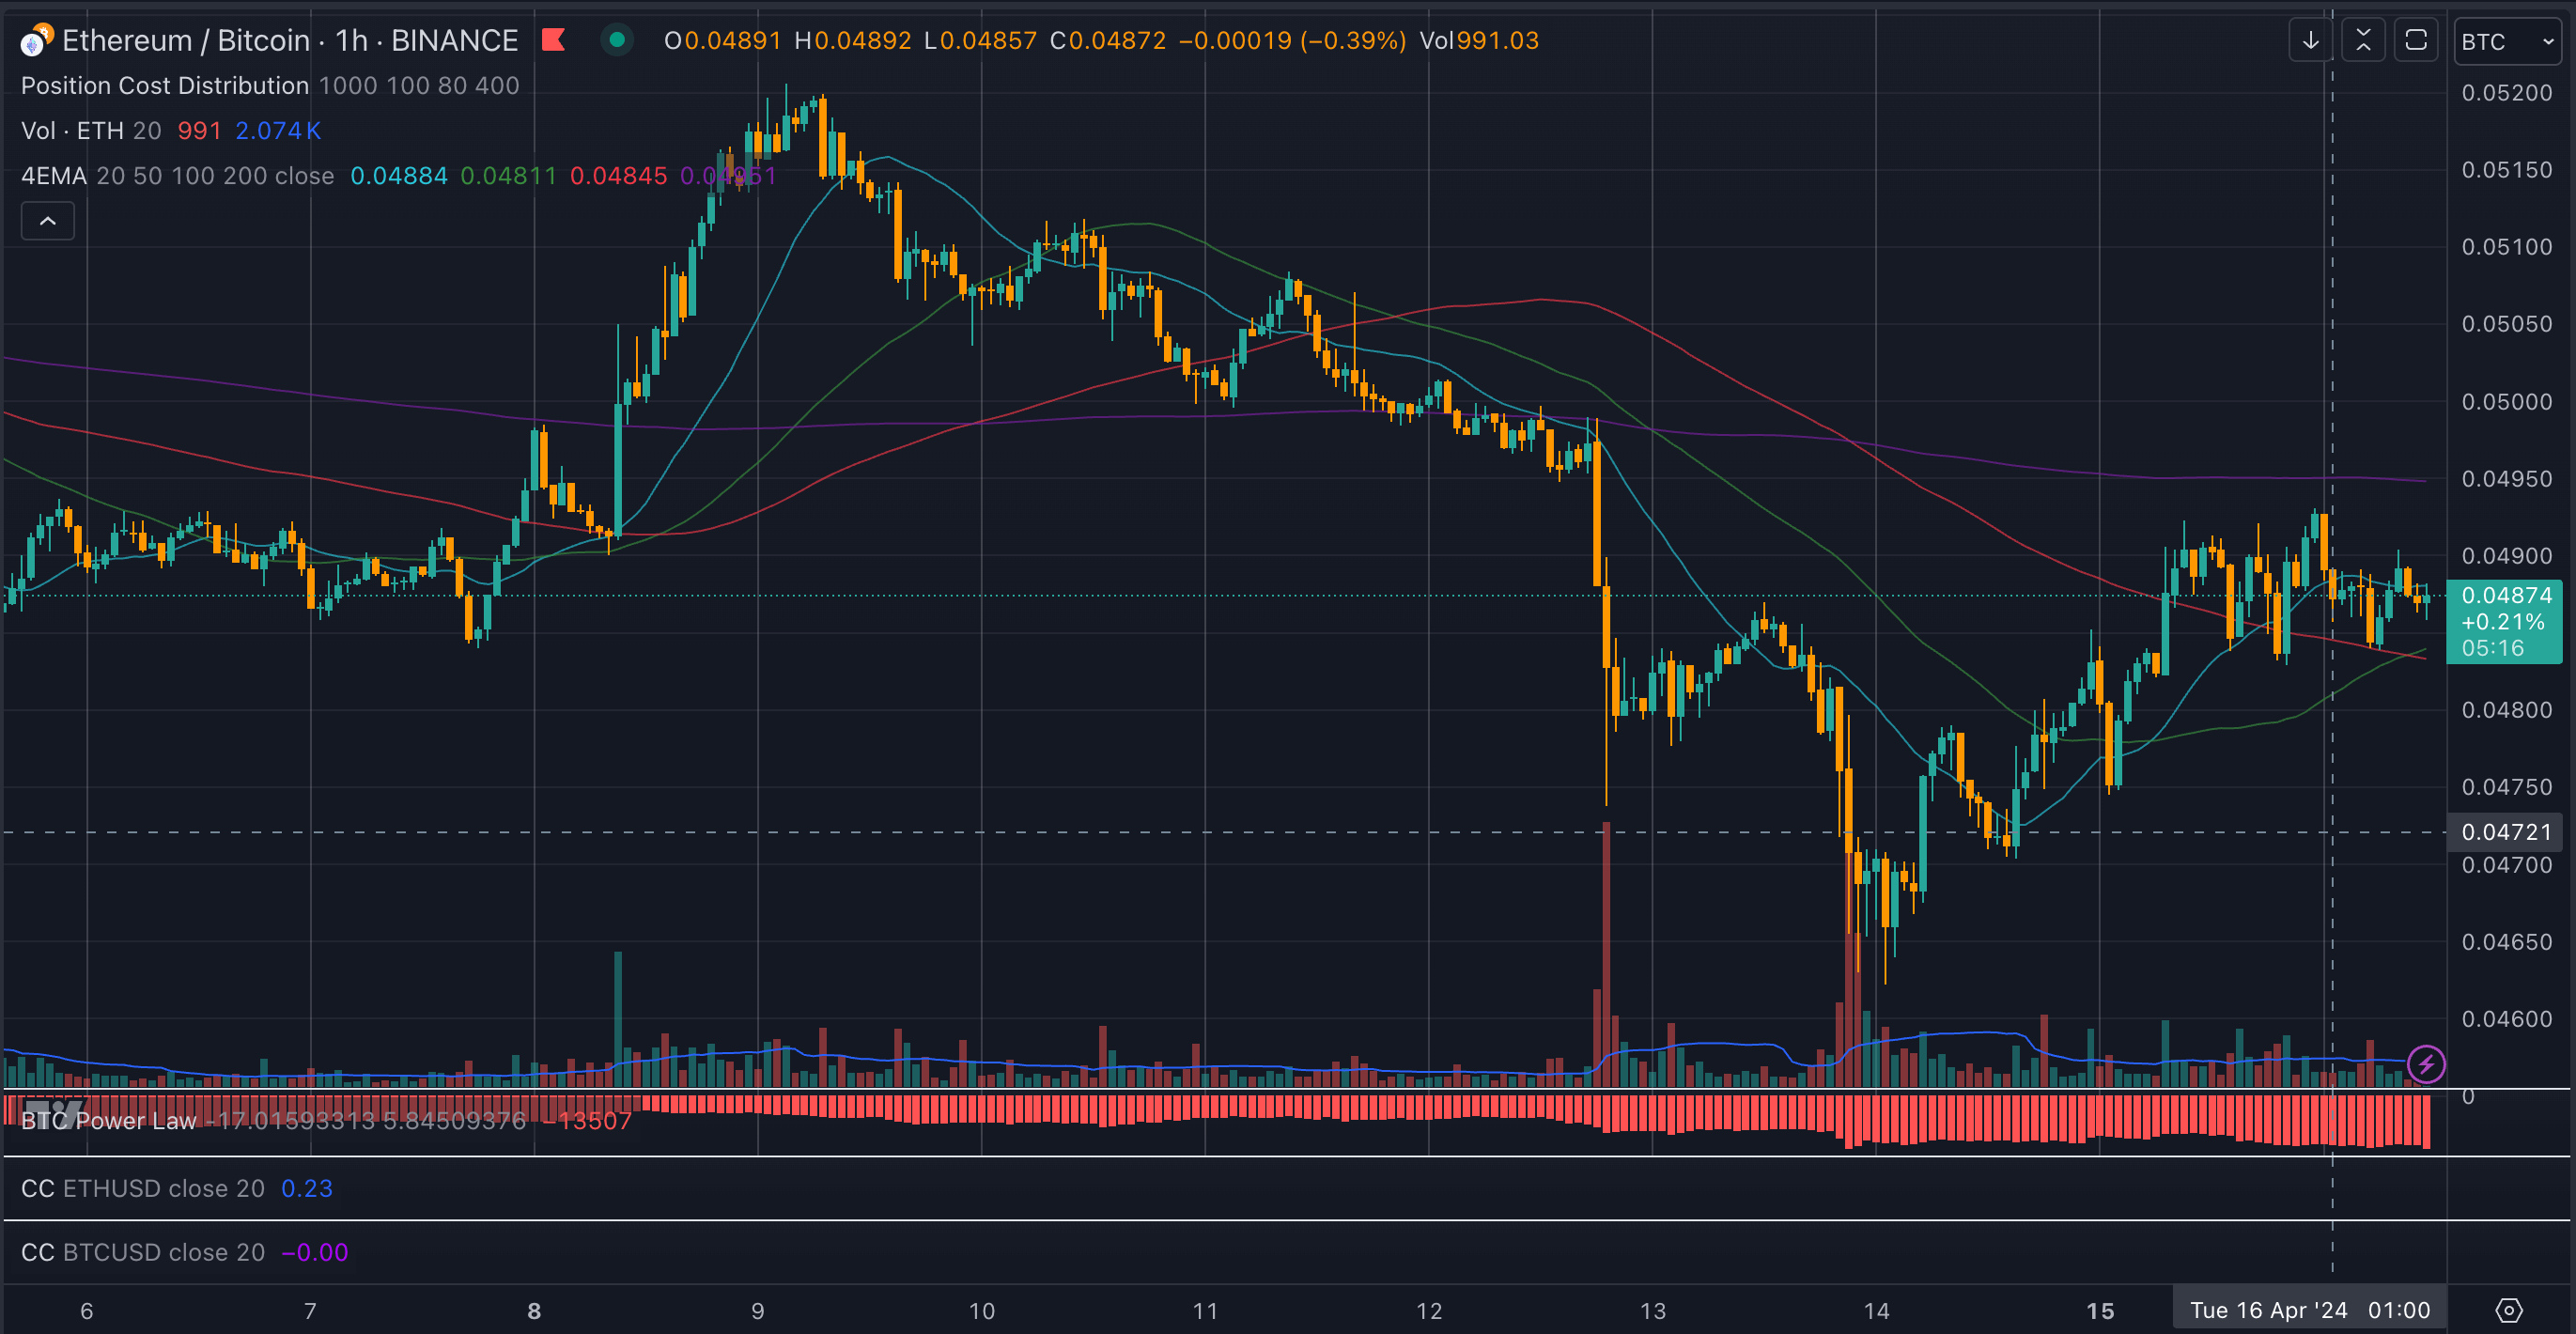
Ethereum fell to a three-year low against Bitcoin amid the carnage that followed Bitcoin’s fall from $70,000 this weekend. The ETH-BTC chart hit a low of 0.0462 BTC on Saturday, April 13, down 24% from the year-to-date high of 0.085 BTC.
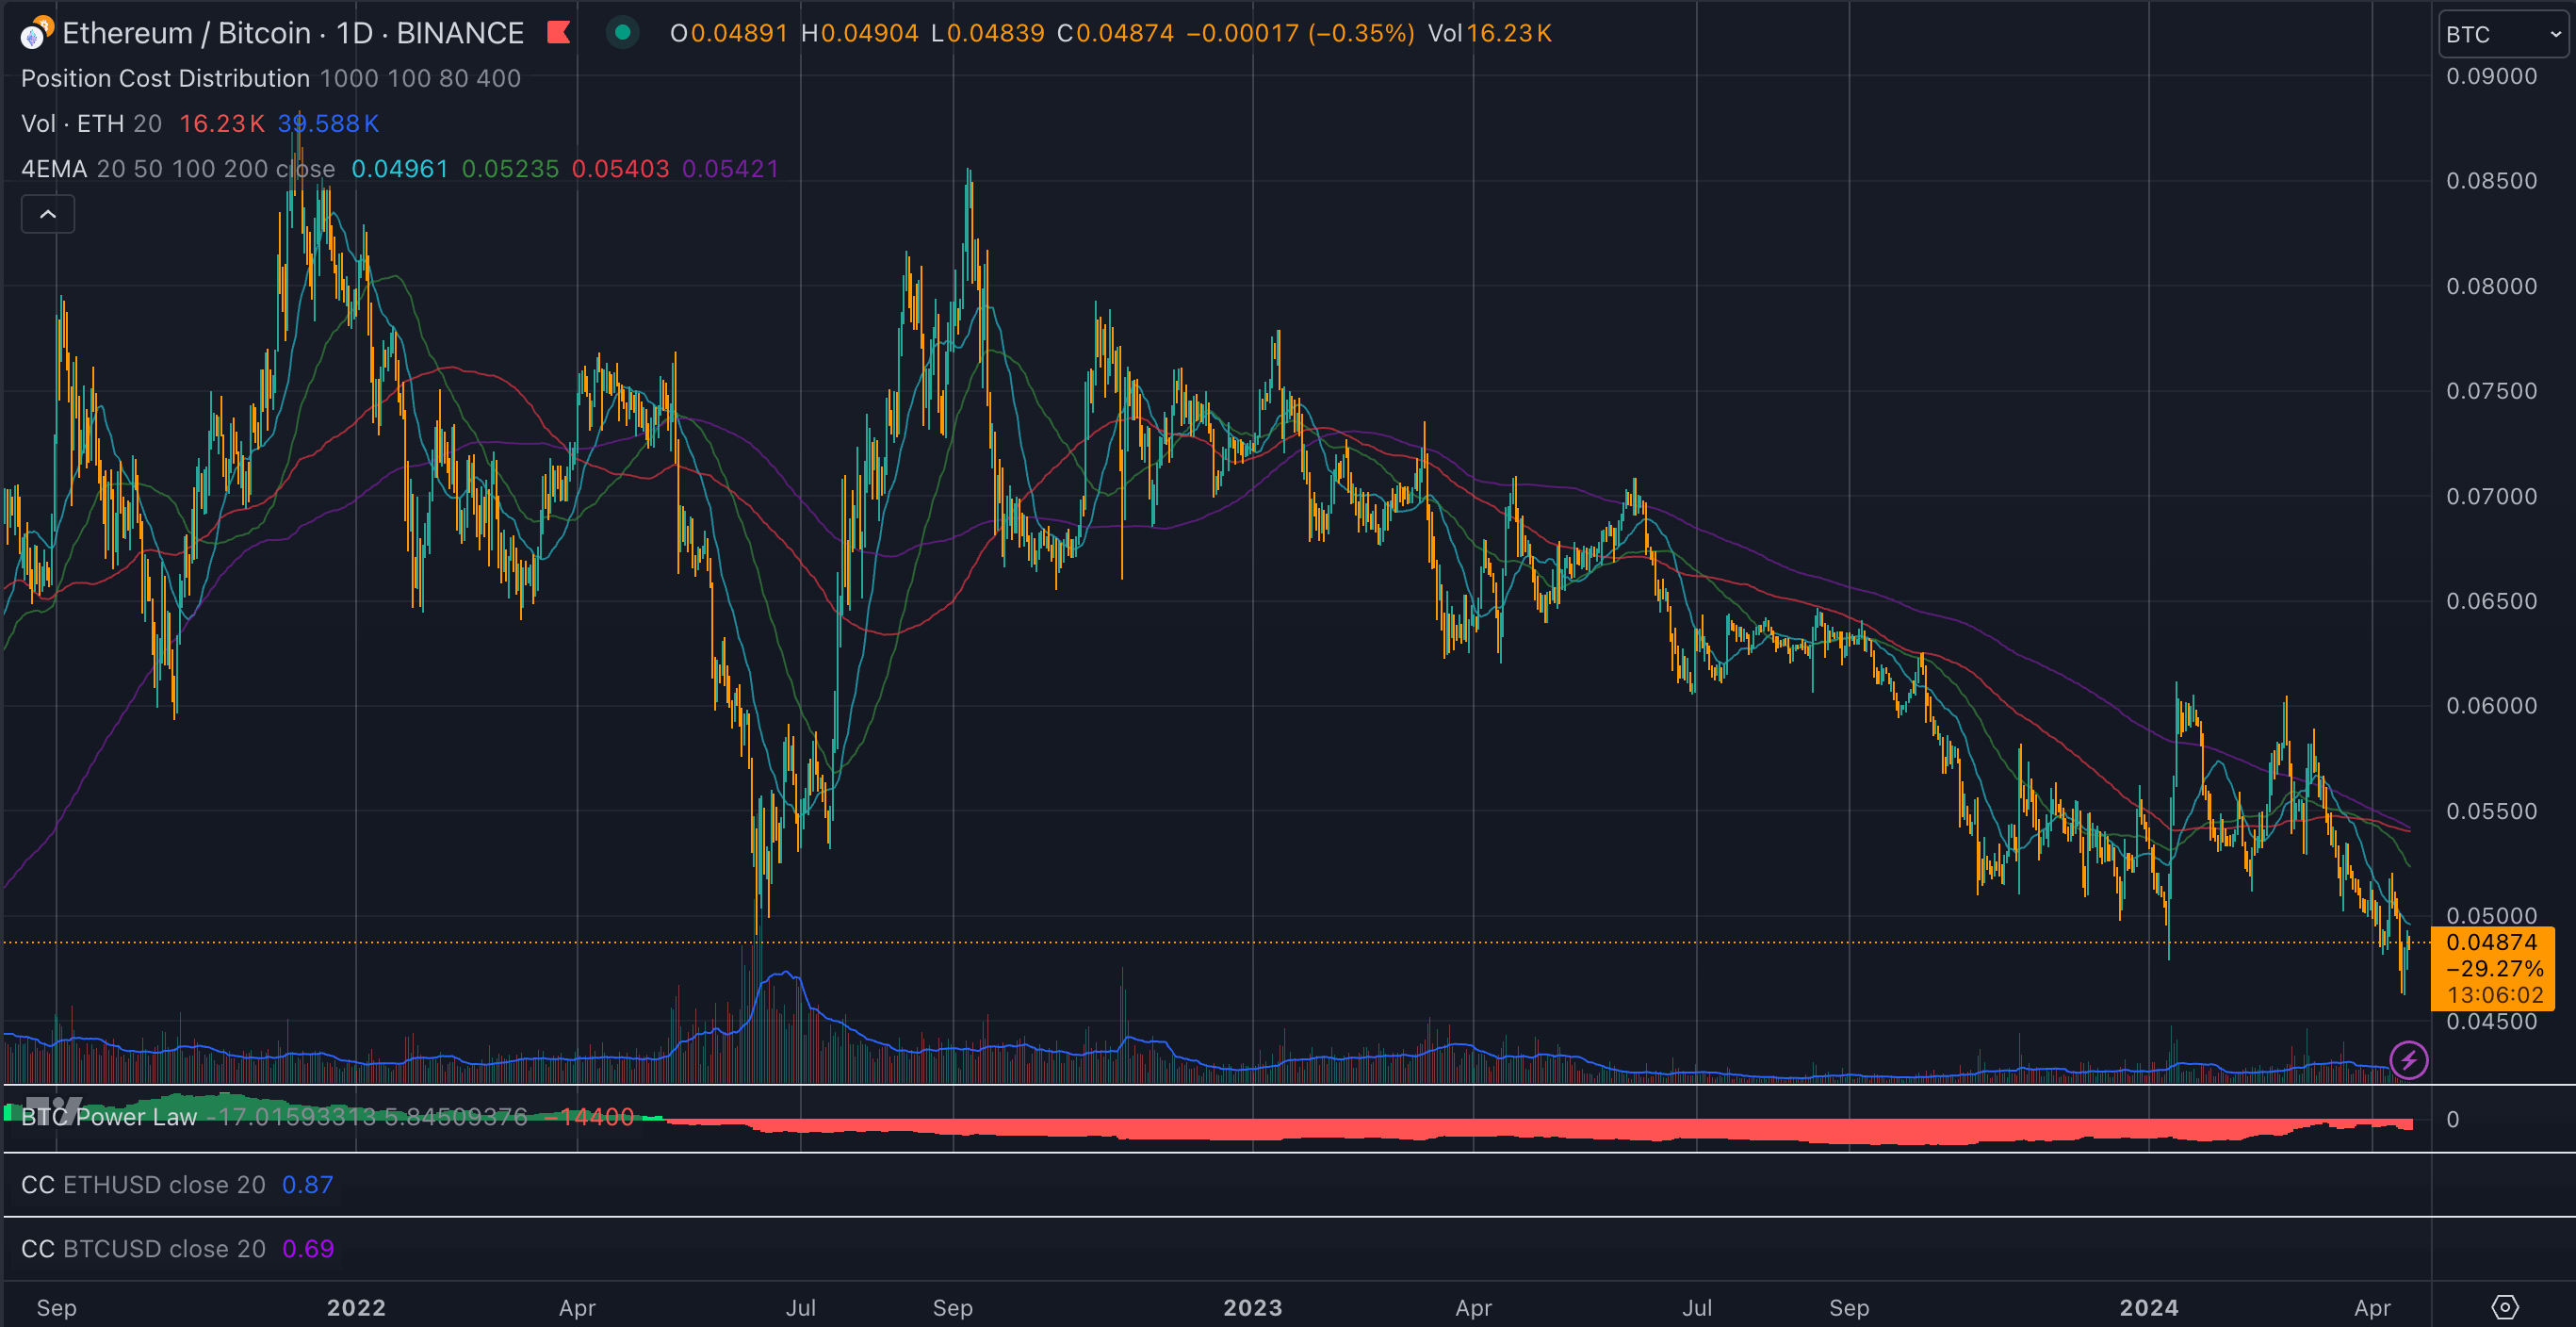
Ethereum’s all-time high against Bitcoin came in 2017 when it reached 0.16 BTC, before closing the year at a similar level to today at 0.048 BTC. Since then, it has recorded lows around 0.018 BTC in late 2019 before rising significantly during the 2020-2021 bull market.
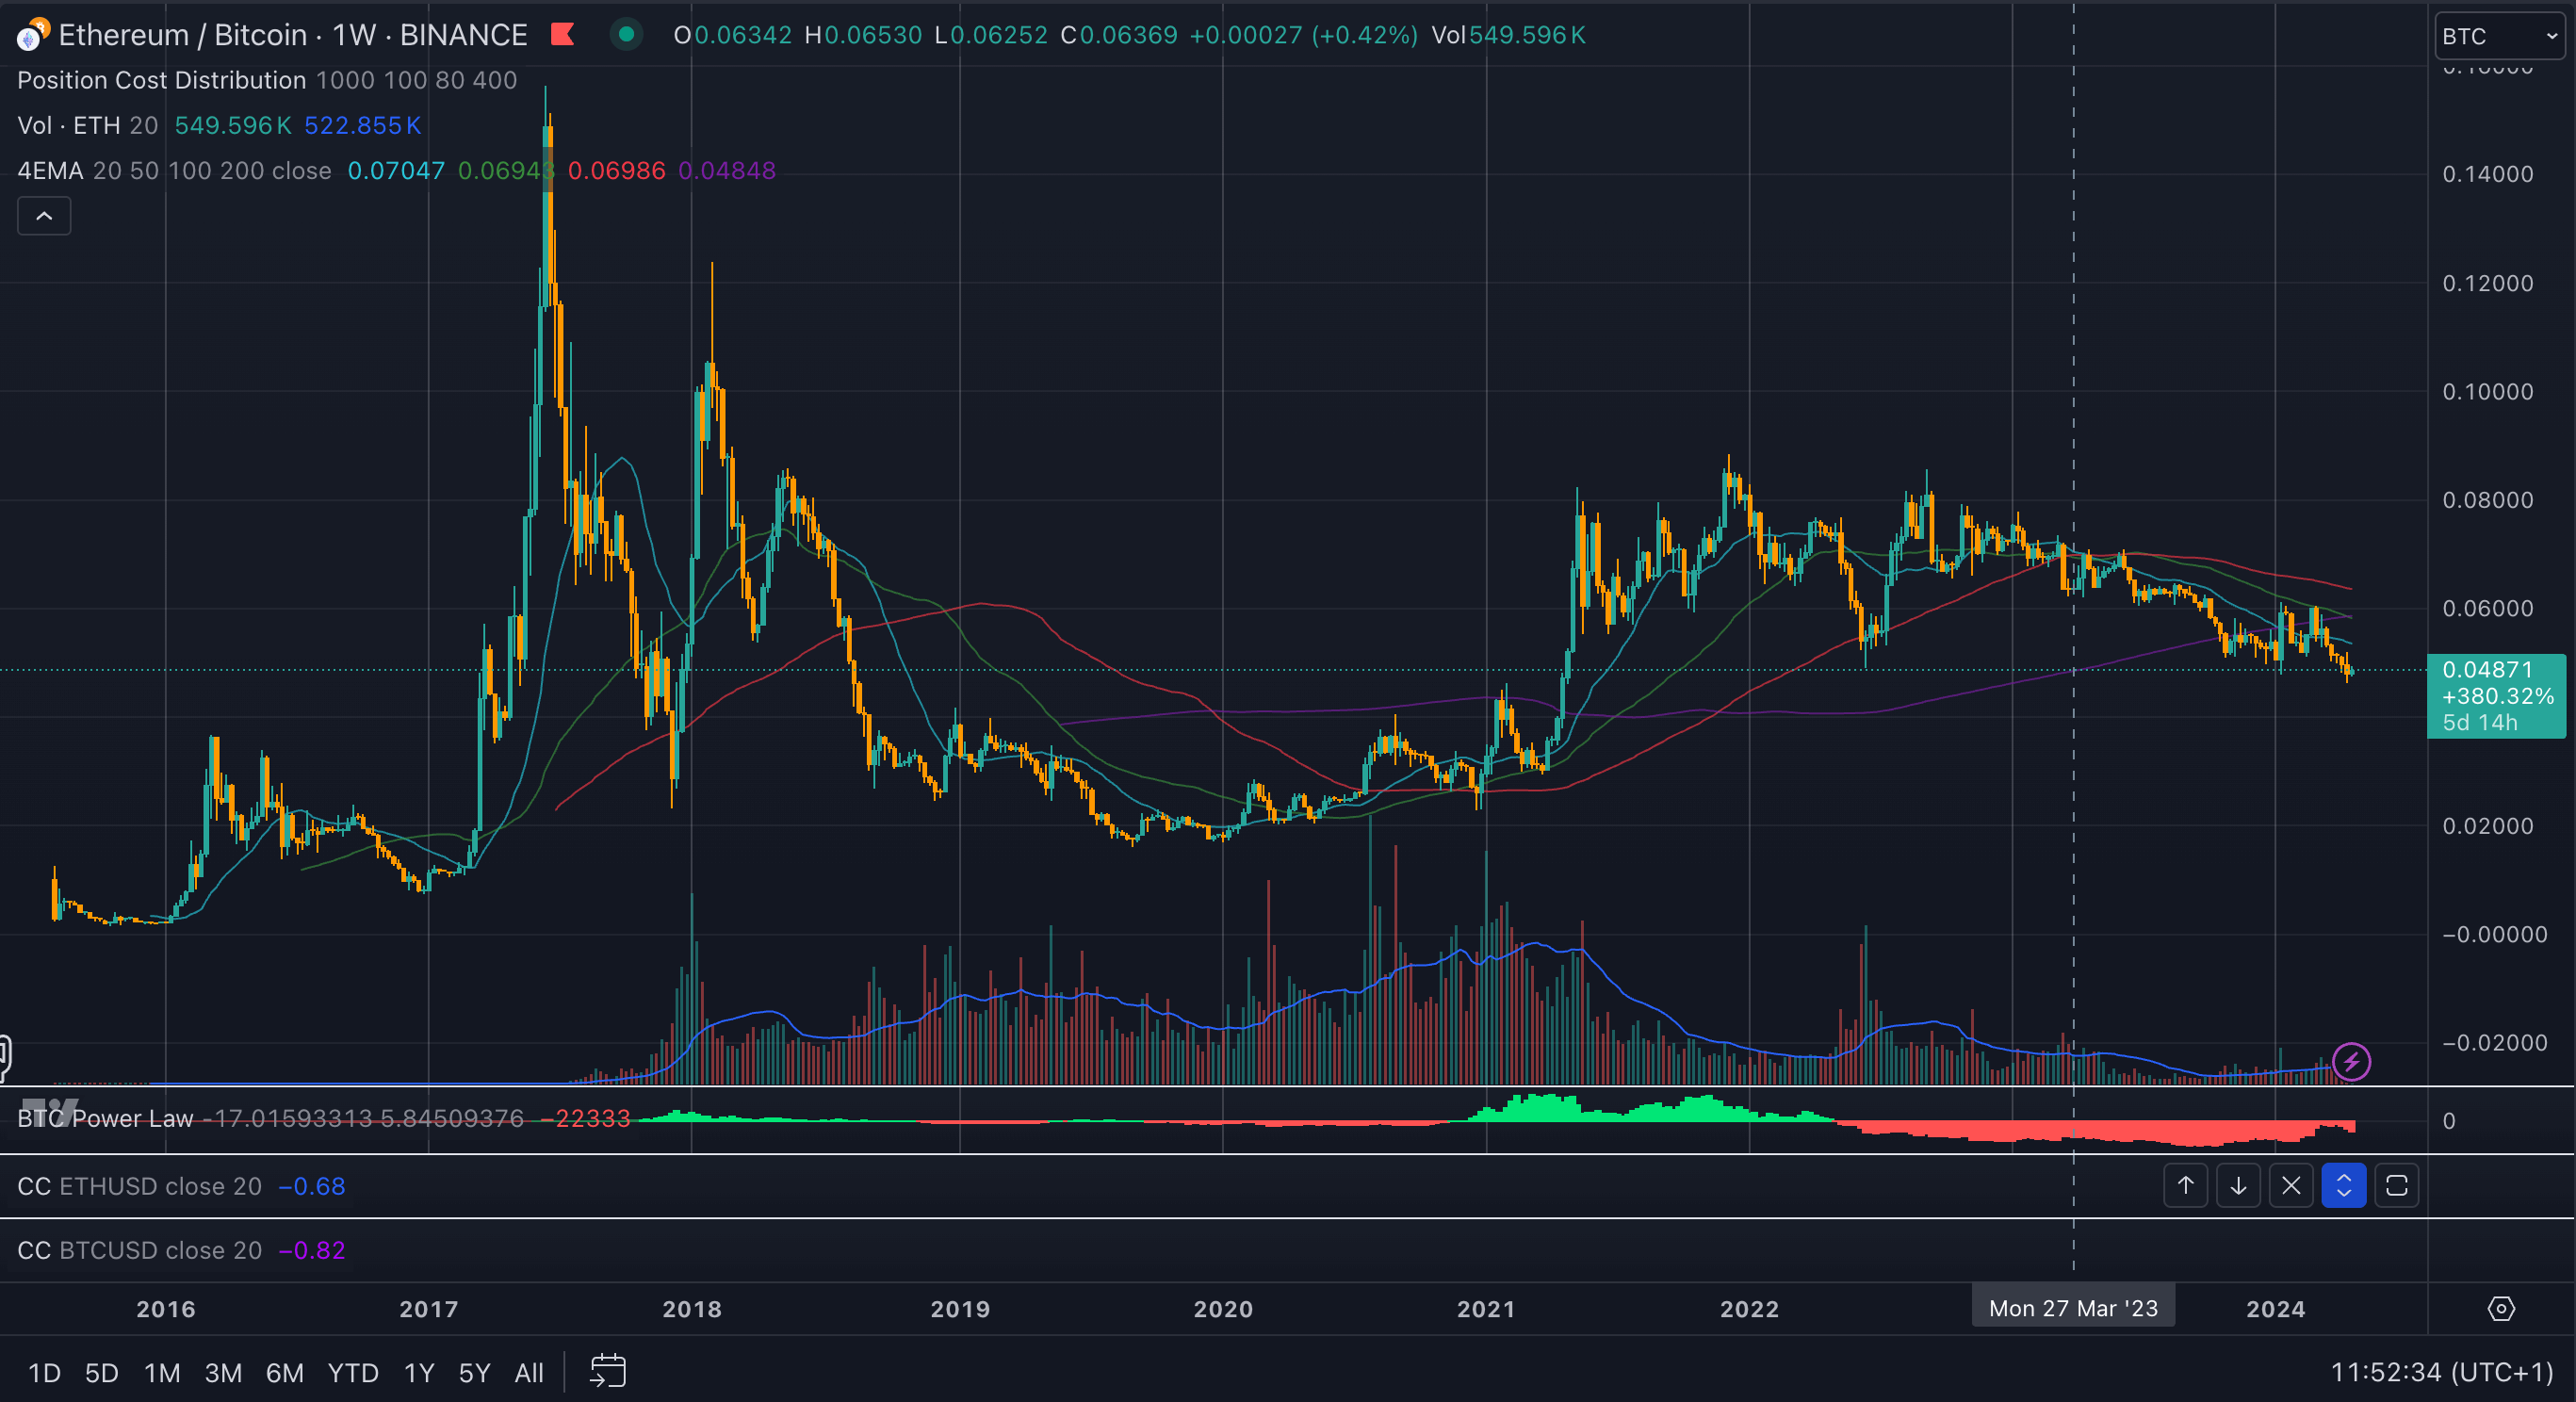

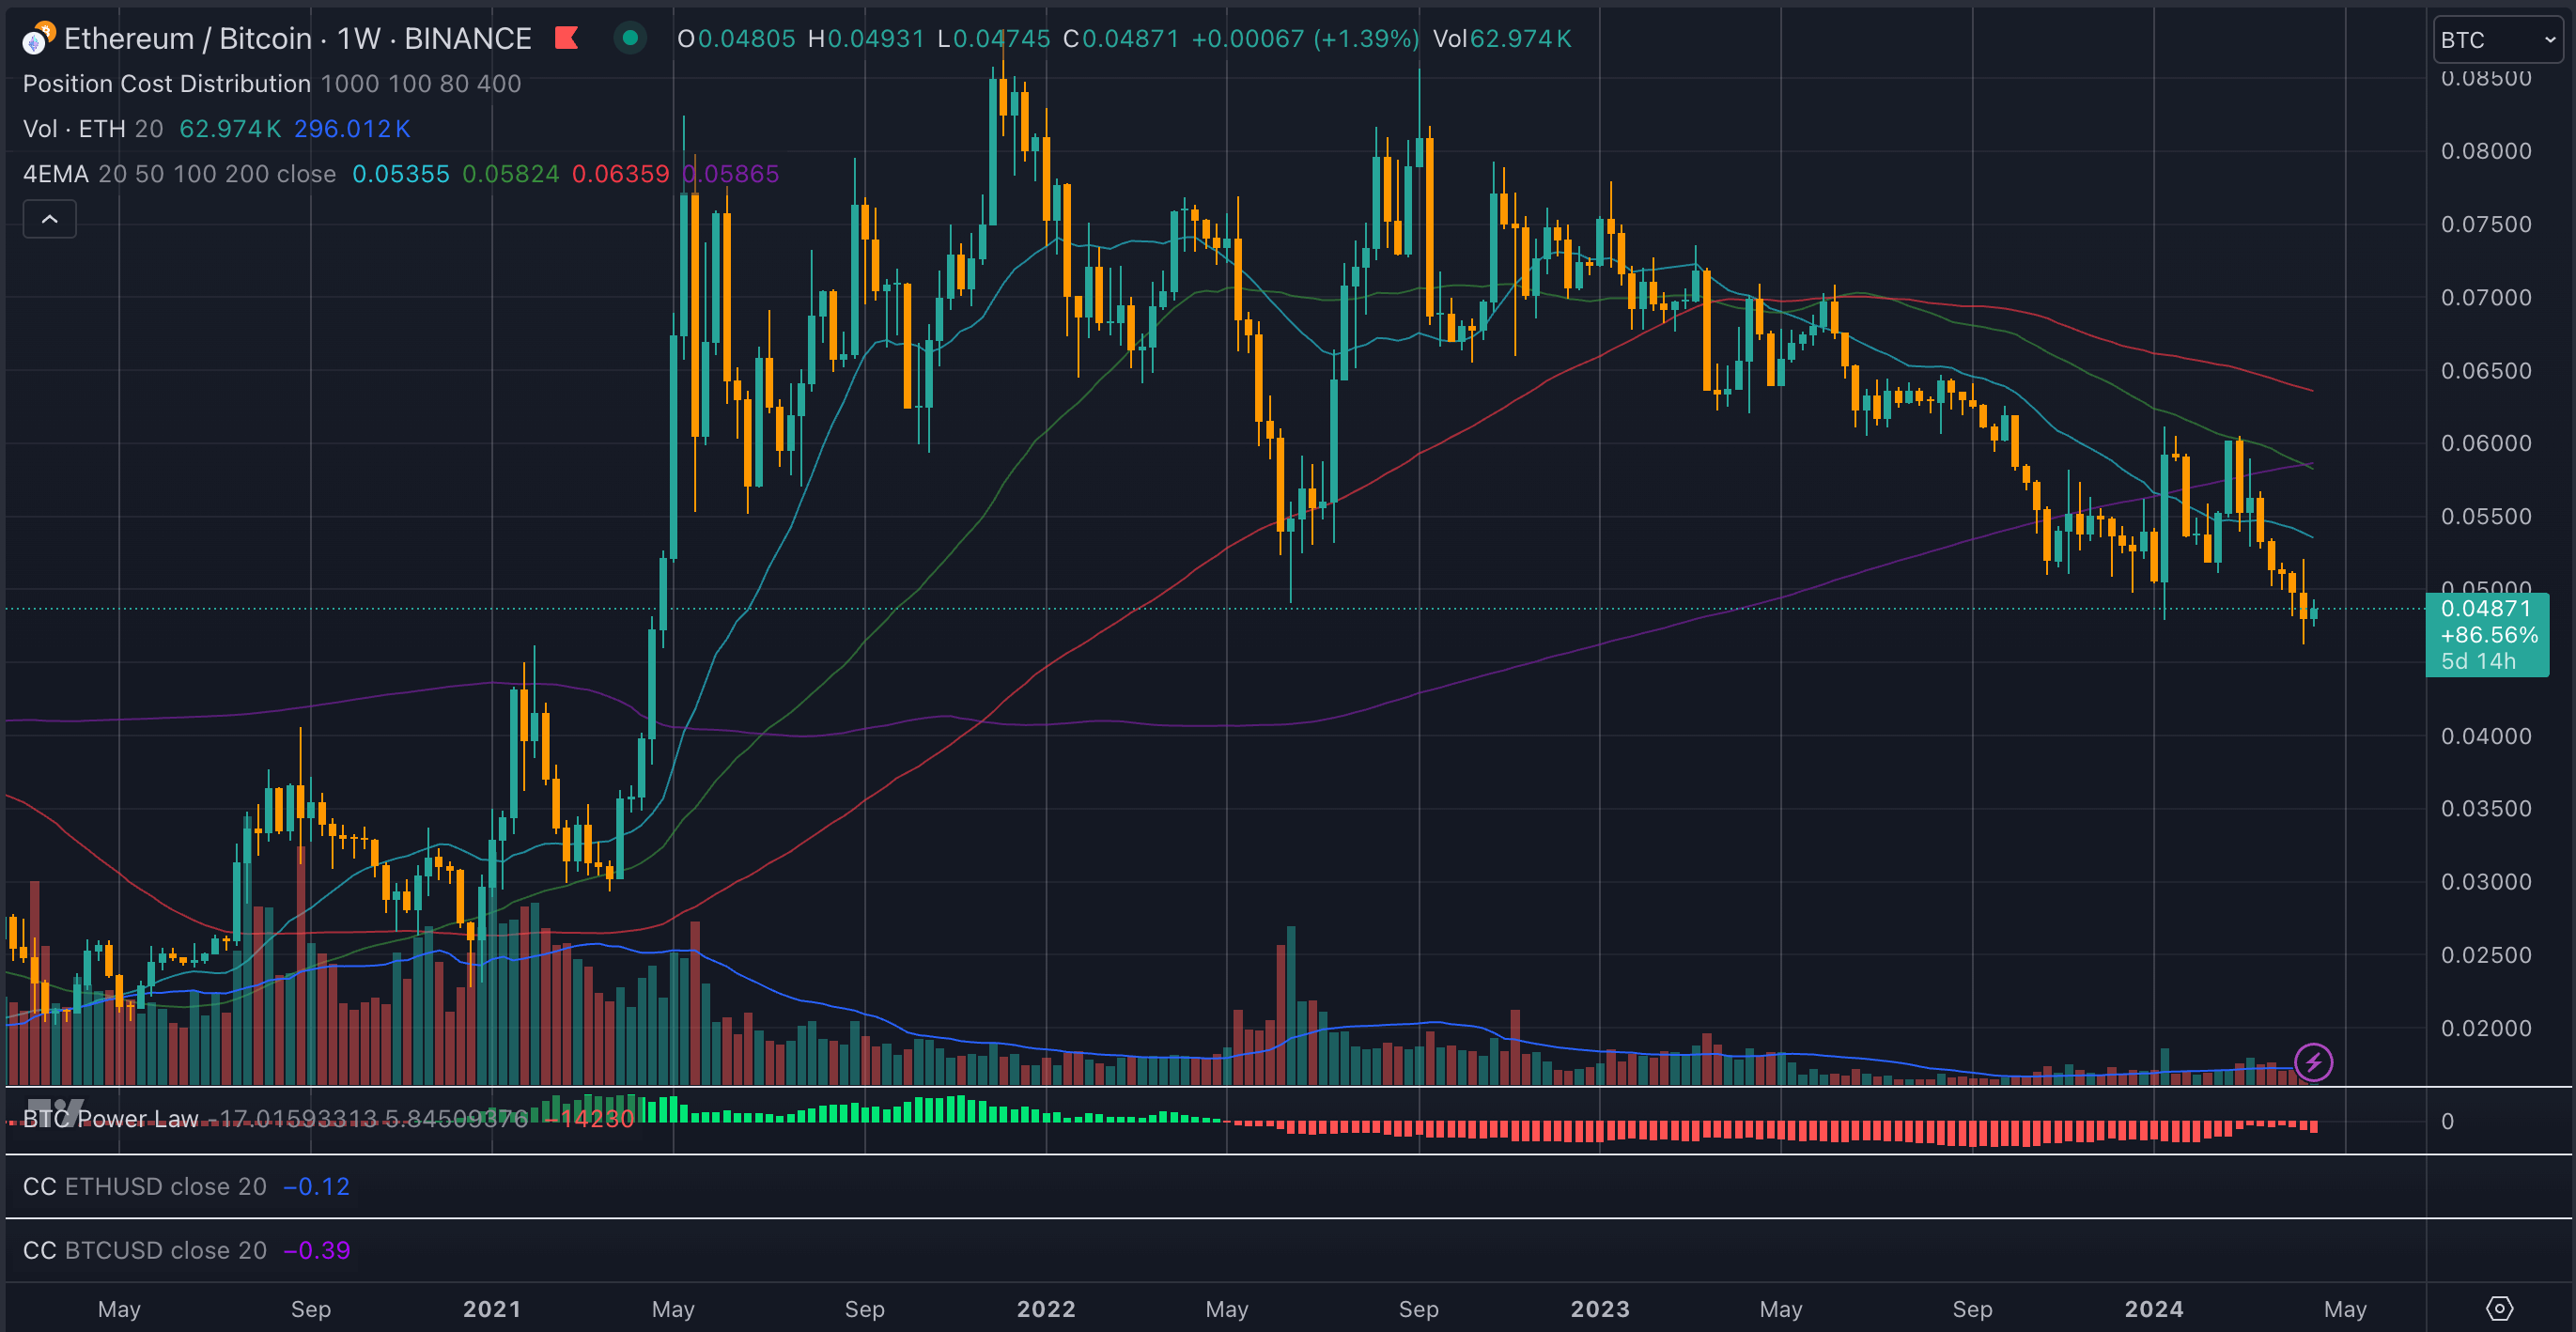
The cycle peak of 0.088 BTC saw a steady decline in 2023, 2022, and 2024. The 0.05 BTC level acted as a lower support level until it was breached this month. While the price remains within 7% of support, it has been almost three years since we have seen these prices.

The decline has been gradual and steady since early 2023, with some bullish breakouts halted within a few months.
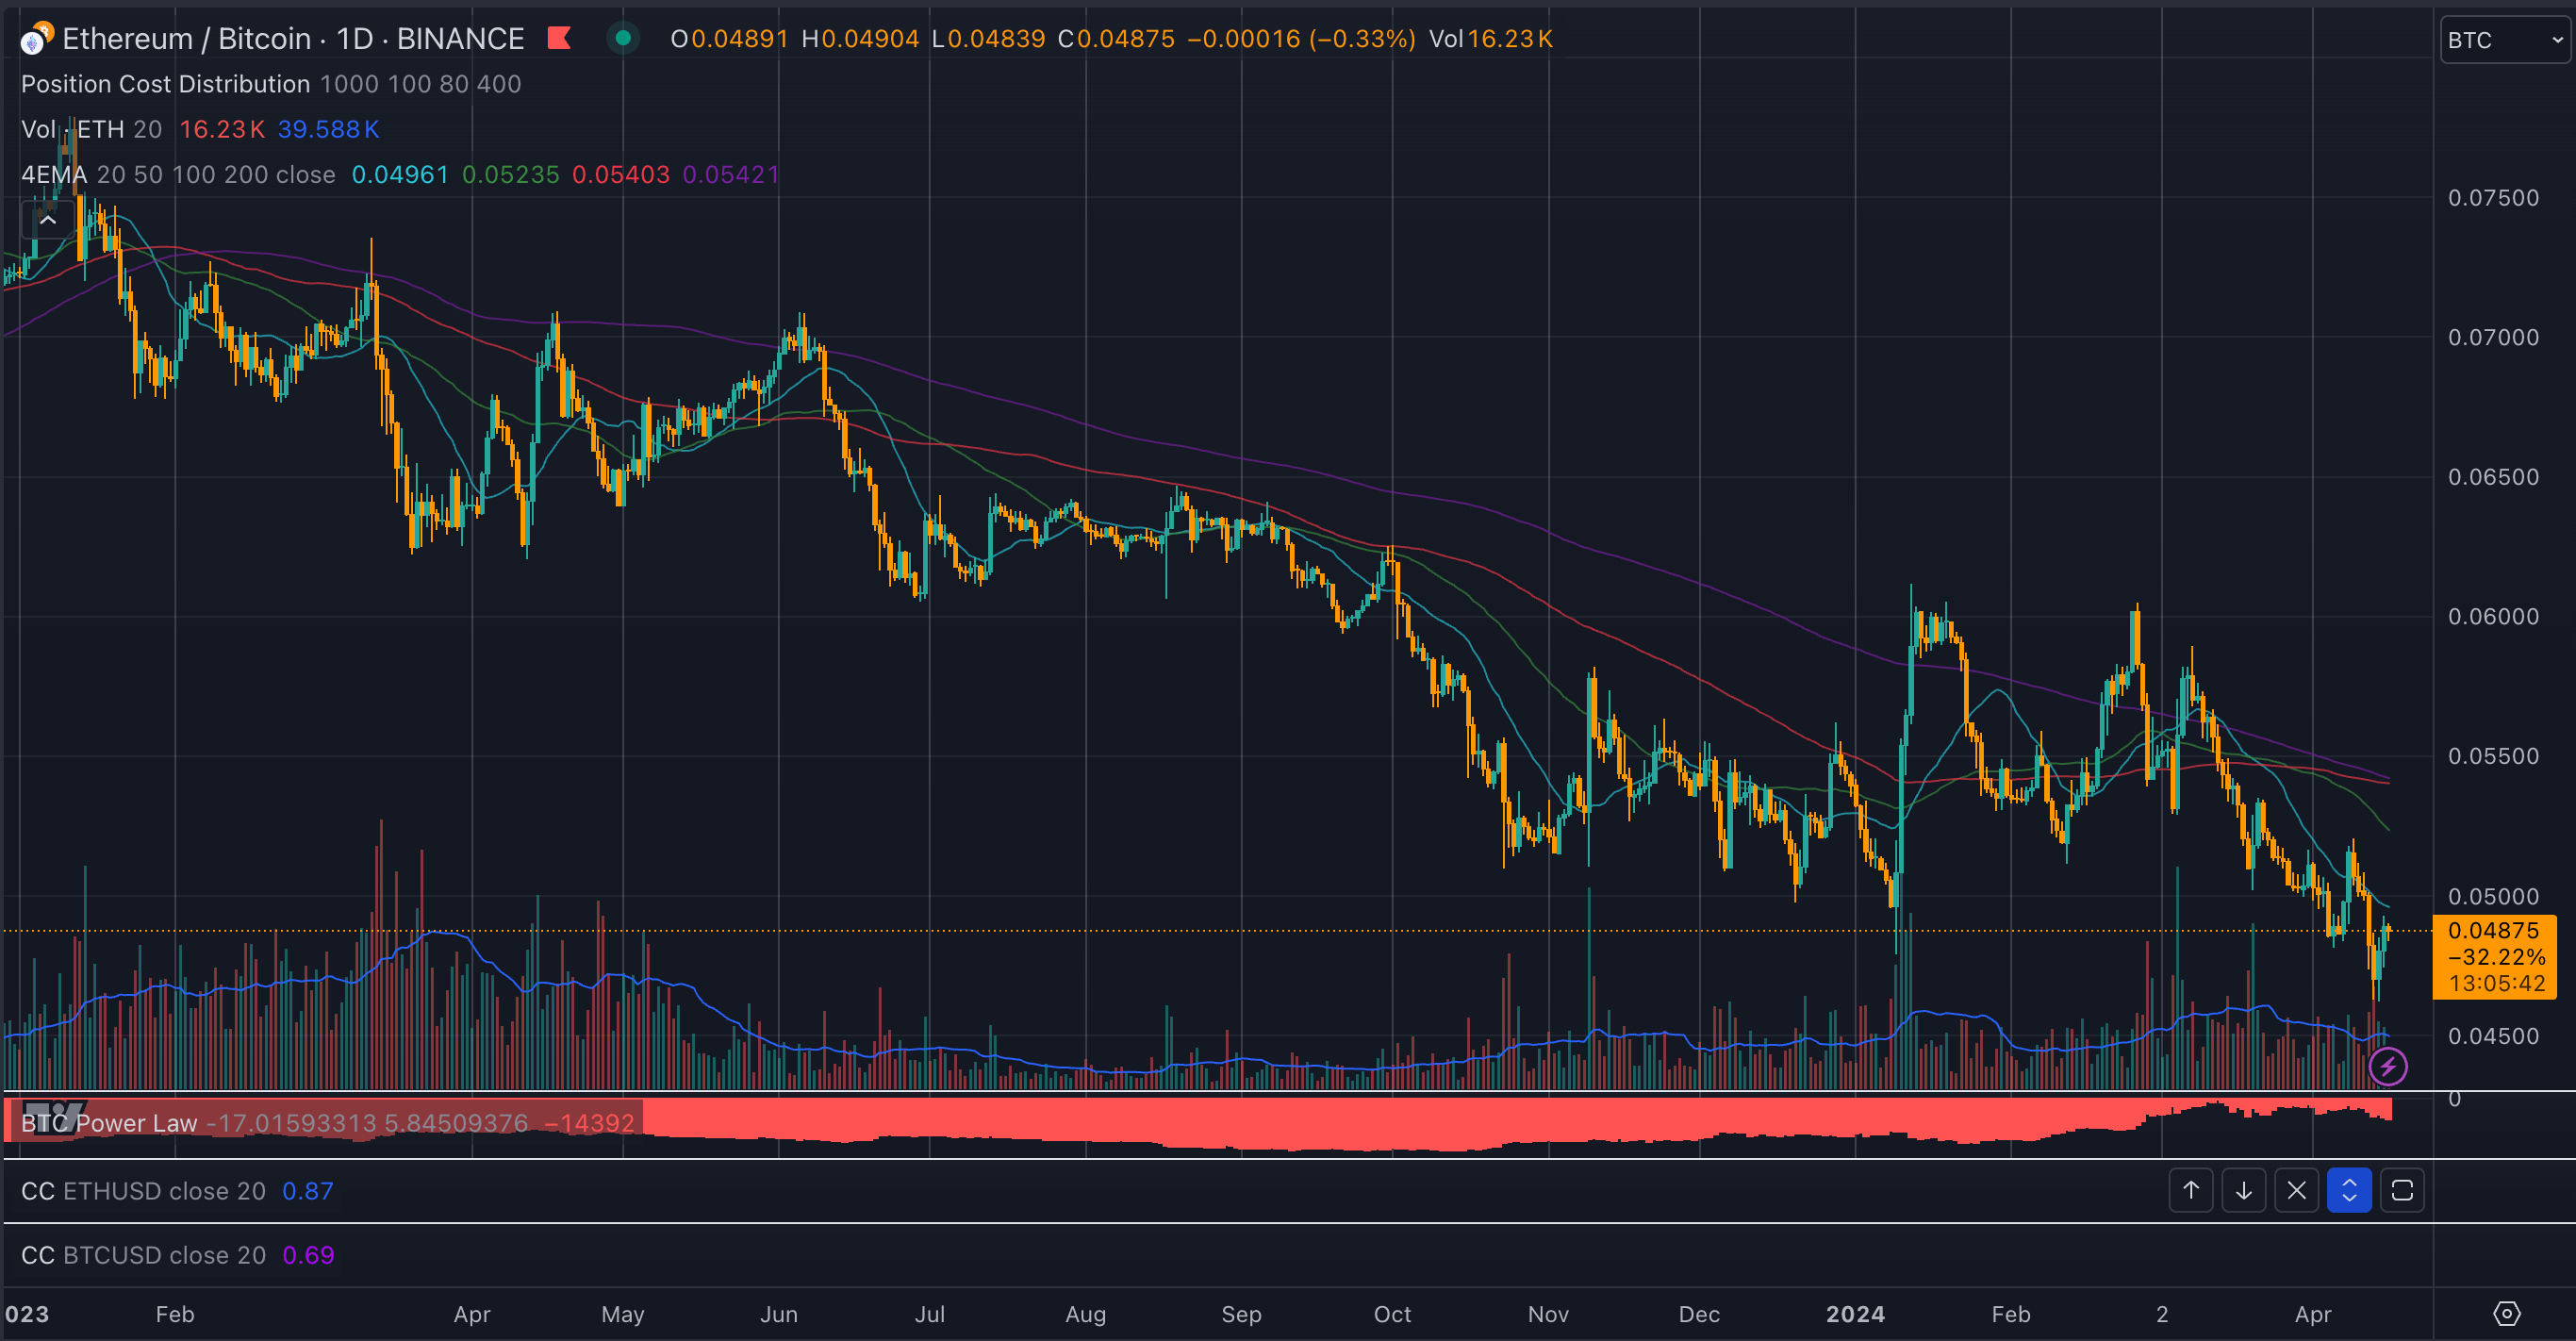

Although Ethereum remains below the 0.05 BTC support level, it has recovered almost 7% from its weekend low, remaining relatively stable amid Bitcoin’s continued troubles. Bitcoin fell from $70,000 to $61,700 over the weekend before recovering to $66,000. However, Bitcoin has retested $61,700 and is trading around $62,000 at the time of writing. Ethereum initially followed Bitcoin from $3,600 to $2,800. Since then, it has consolidated around $3,000, which has helped it in its price war with Bitcoin.

While the overall crypto market often follows Bitcoin, much of the altcoin market follows Ethereum. The ETH-BTC chart has a great influence on the delicate relationship between price movements of digital assets, and is one of the basic elements of the sector. Bitcoin dominance, another critical factor, hit a three-year high this weekend, reaching 57%, while Ethereum dominance fell from a recent high of 19% to just 15%.


