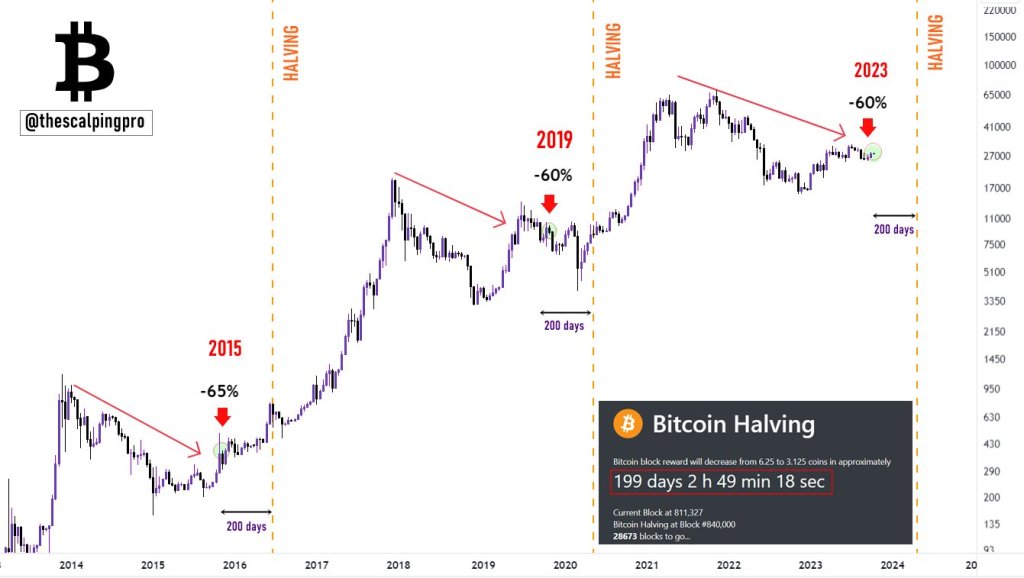
There are still 200 days left before Bitcoin halves, a supply shock that historical patterns show prices tend to rise, even wiping out previous all-time highs when it occurs. In a price chart shared By the “the scalping proAt

Early signs of a bull rally: 200 days before the halving
So far, the trader notes that Bitcoin is down 60% from previous record highs in 2021. This formation, the analyst says, appears to be repeating the same pattern before Bitcoin halved in 2019. Then the coin fell, just as it is today, down 60% from its 2017 highs of around $20,000.
As the historical pattern shows, Bitcoin prices tend to bounce back strongly after sharp losses from previous highs. These rebounds are often accelerated by the momentum of the halving, pushing prices further away from the cyclical low.
Bitcoin halving occurs every four years, where the reward for mining a Bitcoin block is reduced by half. This feature is built into the protocol to delay the issuance of new Bitcoin. Due to the decrease in the number of coins put into circulation during the halving, inflation is reduced, which supports prices, as previous price promotions have shown.
While the impact of halving has been well studied, the sequence of events leading up to this event appears to be driving demand. As previously mentioned, Bitcoin fell about 60% from all-time highs 200 days before the 2016 and 2019 halvings.
The asset’s prices are at a similar price level exactly 200 days before the halving. For this “nearly perfect” replication of events, “thescalpingpro” is optimistic that the coin could follow a known pattern from previous cycles.
Bitcoin Race to $48,000 Before Halving?
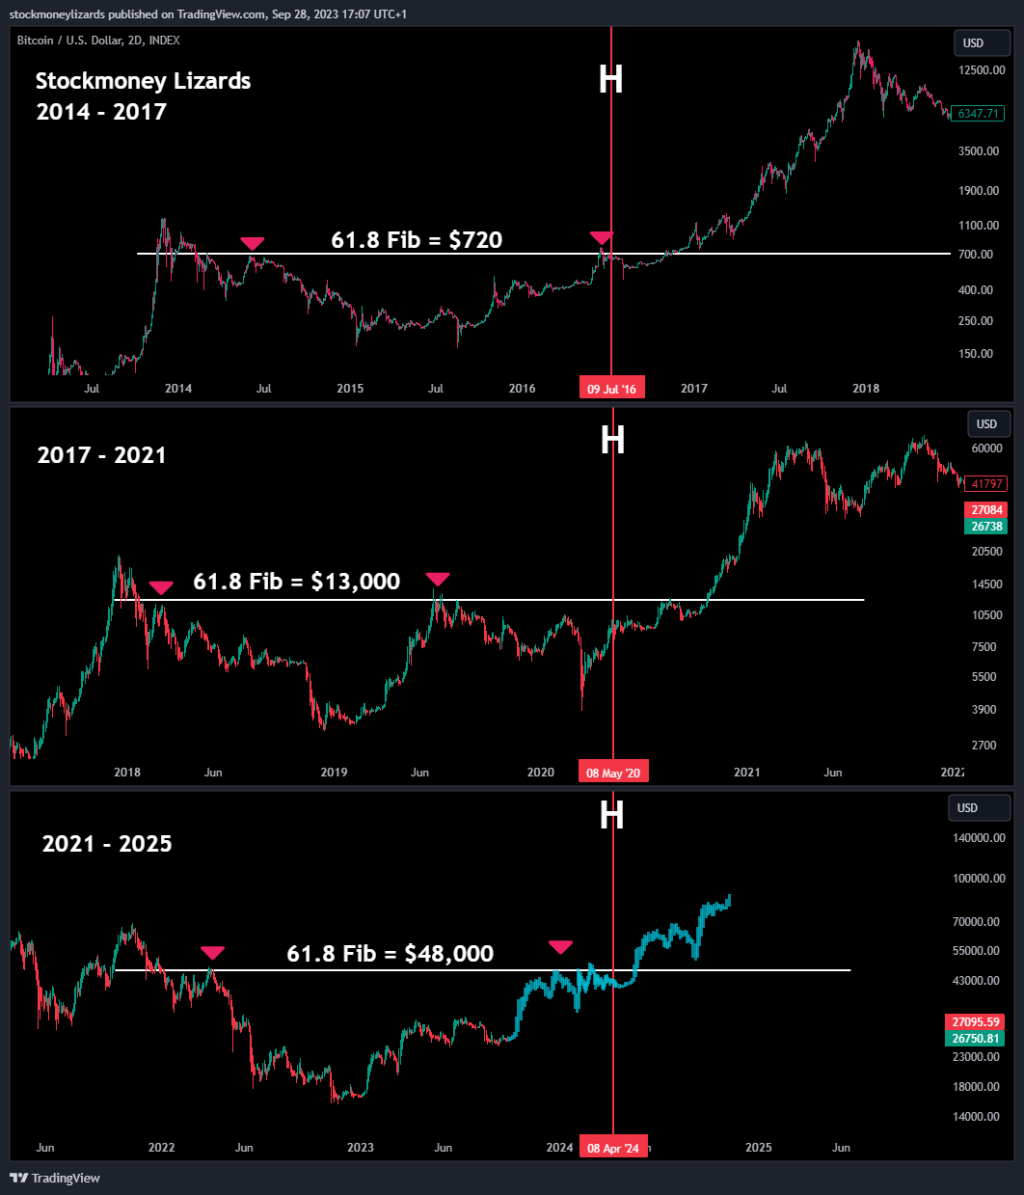
The spike to record highs and beyond is, as predicted, a scenario that could happen once the halving occurs. Before then, however, another analyst believes the coin could rise to $48,000.
The analysis reads based at crucial support and resistance levels formed by the Fibonacci retracement levels. The analyst is confident that the coin will retest the 61.8% swing high low of the recent 2021 to 2022 period, which will put Bitcoin at $48,000 once it recovers.

The race to this level will be further driven by the “halving momentum” and “bear-to-bull transition of several indicators,” including the Relative Strength Index (RSI), Moving Average Convergence Divergence (MACD) and the on- balance volume of the major exchanges, which appear to be oversold.
Feature image from Canva, chart from TradingView

