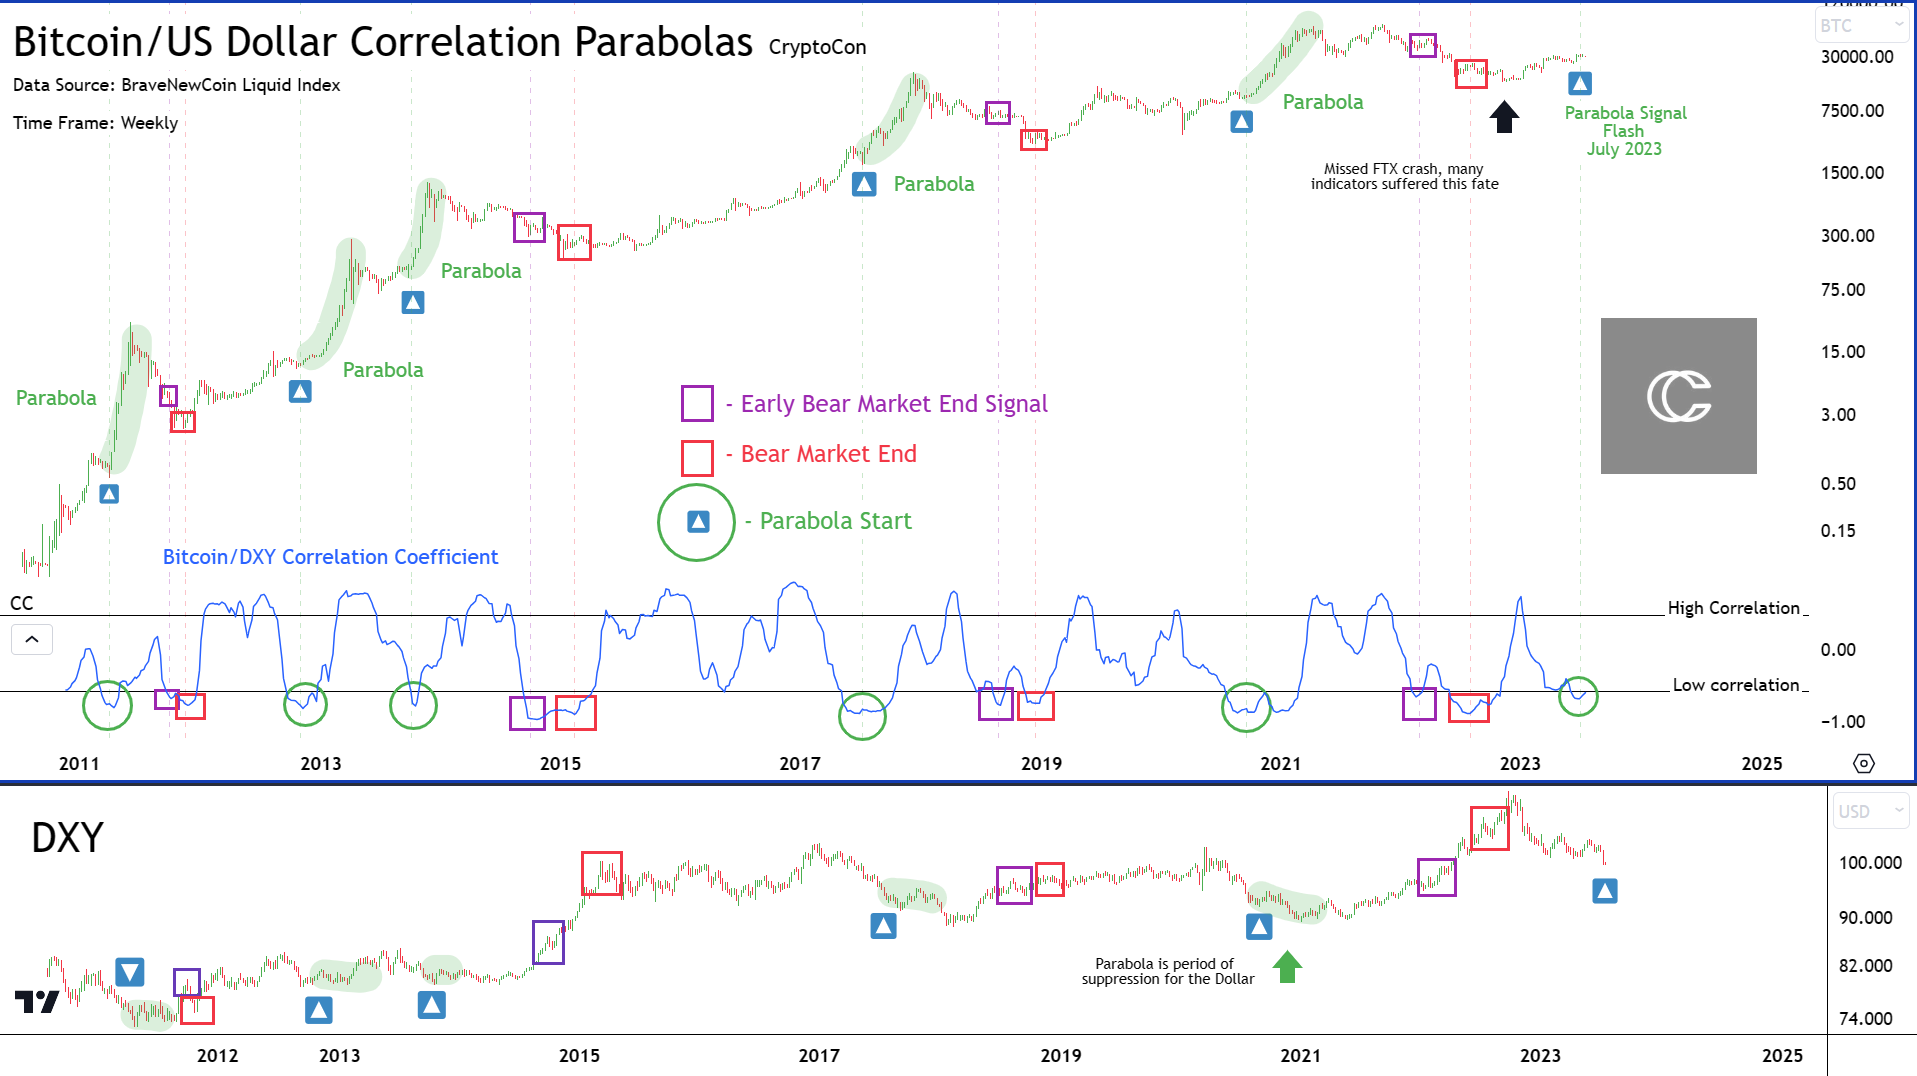
In a recent newsletter by renowned analyst CryptoCon, a groundbreaking indicator known as the “Bitcoin DXY Correlation Coefficient” has caught the attention of the community. Measuring the correlation between Bitcoin and the US Dollar Index (DXY), this indicator has shown remarkable accuracy in predicting Bitcoin’s price movements and signaling the onset of bull market parabolas.
According to CryptoCon, the Bitcoin DXY correlation coefficient is “one of the most interesting finds” it has come across in quite some time. In his newsletter, he explains the importance of this indicator and its implications for the future of Bitcoin’s price trajectory.
Bitcoin at the start of a bull market parabola?
The analyst points out the three different phases that the correlation coefficient goes through during a market cycle. He states, “During a given market cycle, the correlation coefficient enters this zone in 3 phases.” These phases are represented by different colors:
- PURPLE: The first move into the low correlation zone, which occurs slightly before the bottom of the bear market.
- RED: The second move into the low correlation zone marks the end of the bear market or the bottom of the cycle.
- GREEN: After some time, the metric returns to the low correlation zone, signaling the beginning of the true bull market parabola.

CryptoCon emphasizes the importance of these findings saying, “And…there are no false signals when you look at it this way, extremely interesting! I have looked at some other observations that indicate this, but not at this level of accuracy and caliber.”
Furthermore, the analyst points to the influence of the US dollar on Bitcoin’s parabola. He explains: “And this comes from an external factor, the dollar. This means that the strength of the US dollar greatly influences when Bitcoin parabola occurs.” This correlation adds an extra layer of complexity and highlights the interplay between these two market forces.
Drawing comparisons to the 2013 cycle, the analyst speculates on Bitcoin’s potential future trajectory. He suggests that the coming market cycle could resemble a two-curve pattern. CryptoCon states:
I believe this could look something like a 2013 cycle. If we do indeed expect an early strong bull move, it could come in the form of two curves.
He elaborates on the timeframes for these curves, saying, “The first comes early and would probably end sometime in 2024. The second comes later and ends in late 2025 according to my Nov. 28 Cycles Theory.”
The analyst also shared his price forecasts for the upcoming bull market parabola. He says, “As for the price target of this parabola, I’ll speak to the former. Personally, I would expect it to be just above or below the ATHs. The secondary later tops out at 90-130k which is my personal range and projection for the cycle.
Concluding the newsletter, he highlights the potential opportunity ahead for Bitcoin investors. He states, “So regardless of the short term, big things are on the horizon for Bitcoin according to data. And maybe…just maybe…you won’t have to be as patient as you think.”
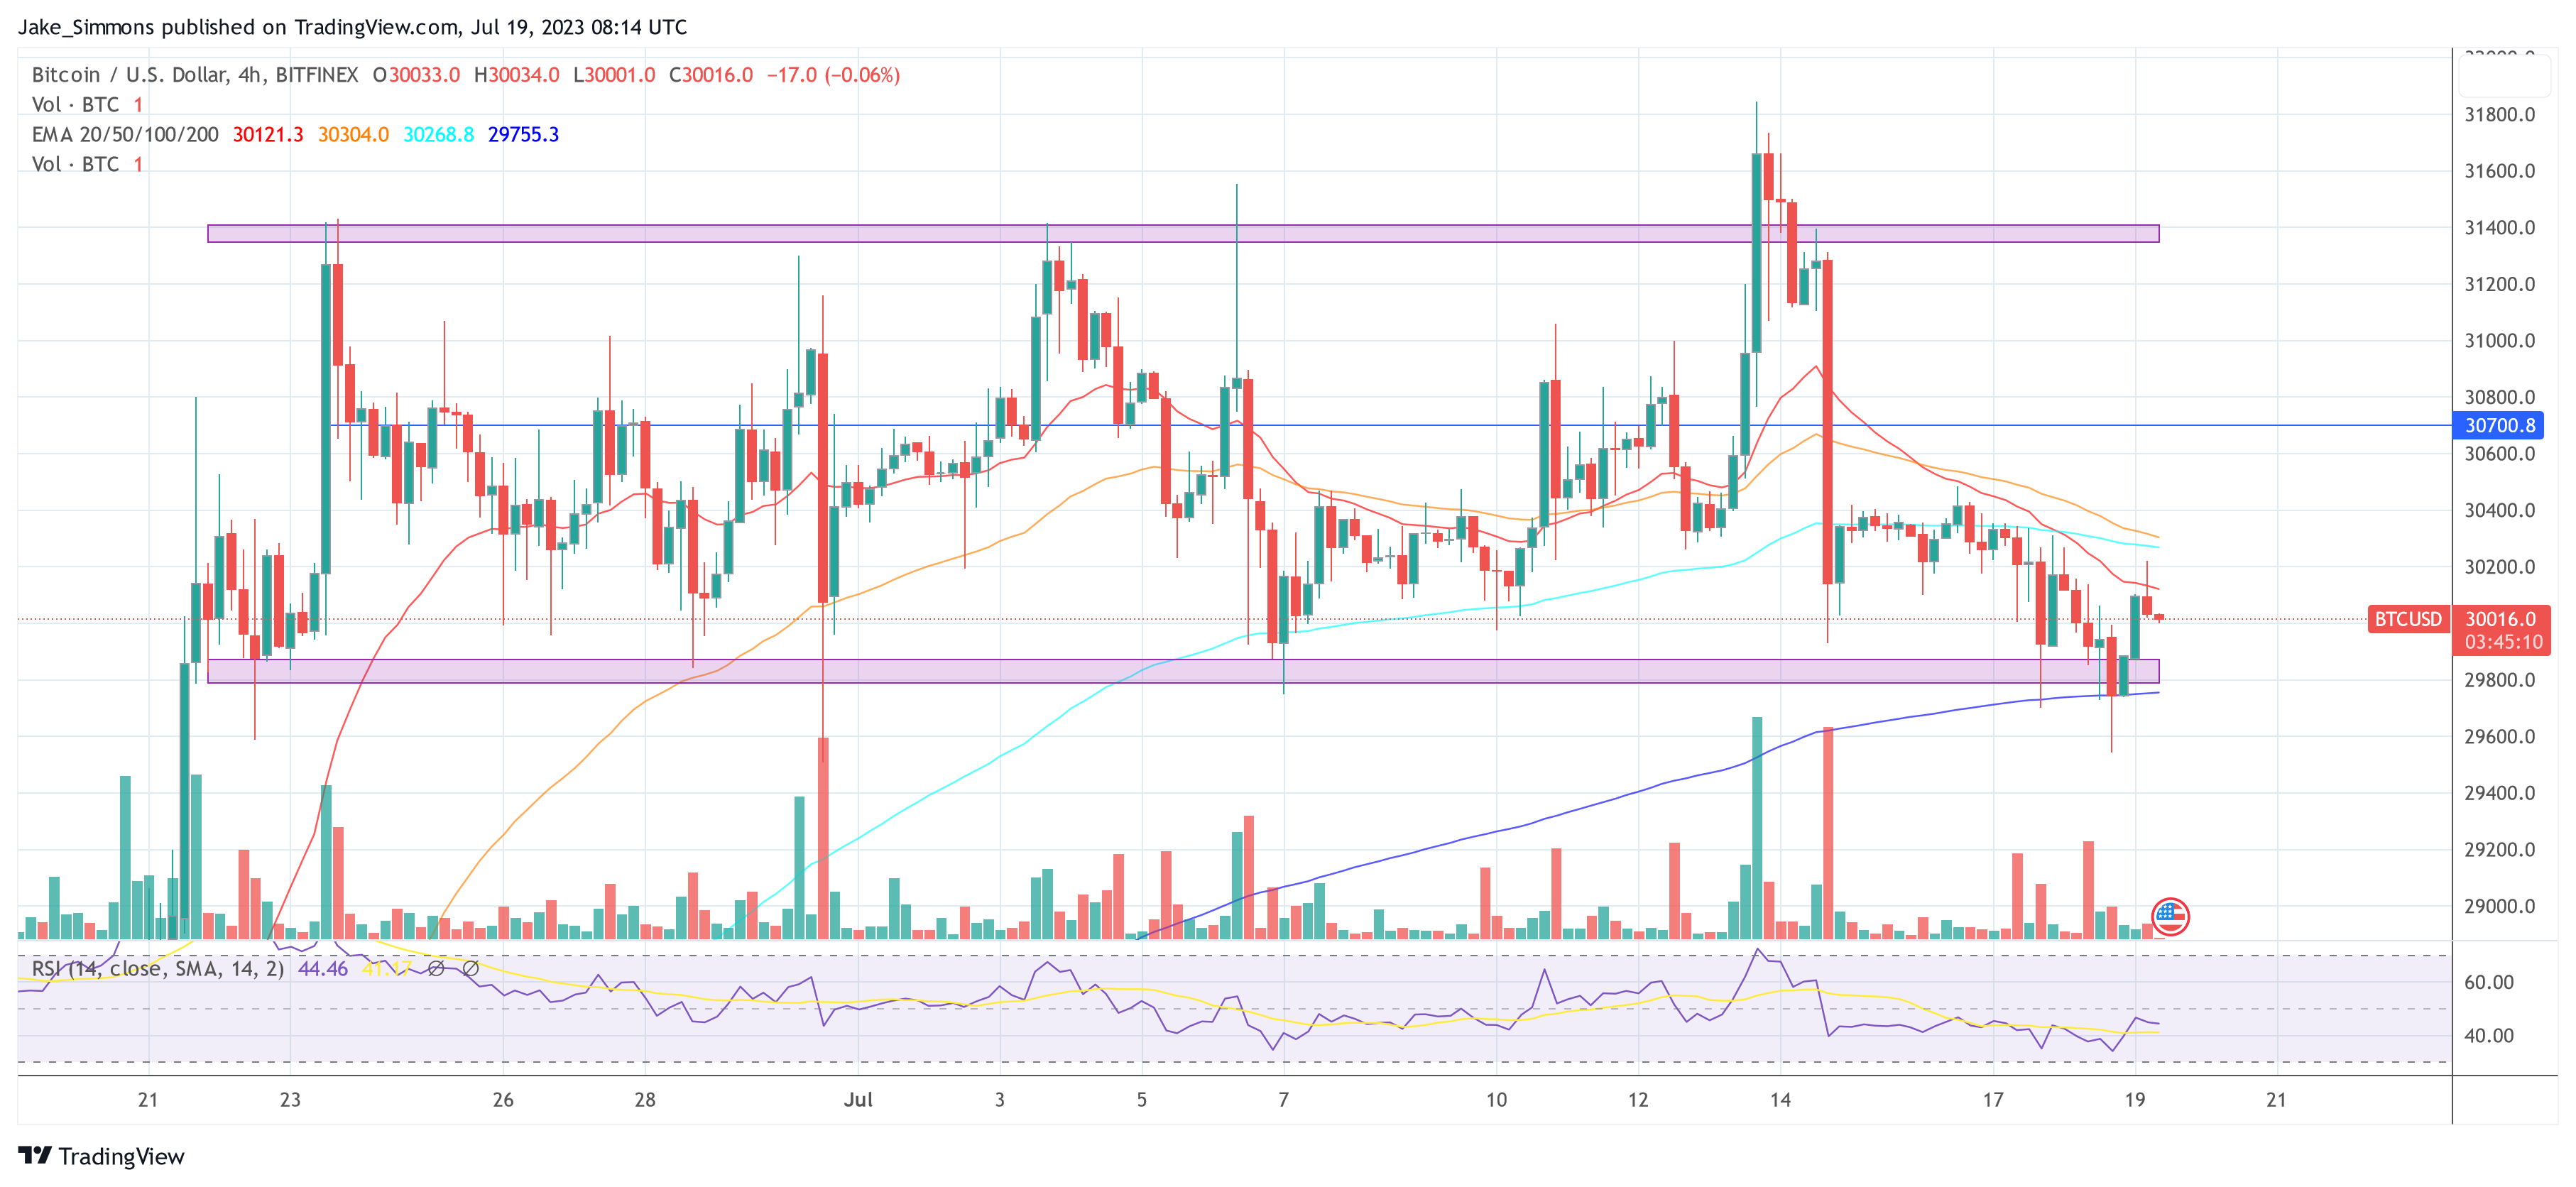
At the time of writing, Bitcoin was trading at $30,016.


